
 |
| Today's post highlights the effects of inflation on the US economy in the past decade and a half. Fun! |
Young Retail Retell, it turns out, was just as much of a nerd as his older, more tired counterpart. Long before he ever dreamed or even heard of starting a flickr page or running a blog on which to share supermarket photographs, history, and research, as an eight-year-old he dragged his parents to three different grocery stores on three consecutive Fridays to compare prices and see which store was cheapest. Even back then, I was fascinated by brands, logos, and stores: no one can say I'm not consistent! The project, titled "Spend a Little, Spend a Lot," was the result. Check it out below:

We start with the page summarizing the entire project from start to finish. To summarize the summary, the gist of the project was to see which local grocery chain -- Walmart (which, you'll notice, I stylized even in my own handwriting with the star logo; that's dedication right there), Kroger, or Schnucks (RIP) -- had the lowest prices over that three-week period in January 2006 (a mere 17 years ago...). I anticipated Walmart would come out on top, and while the sale prices at the other two sometimes did win out, Walmart was cheapest overall.

Backing up my summary was the actual data page, showing the comparison by item, store, and date (with sale prices in parentheses next to the regular prices at Kroger and Schnucks). I compared 10 items at each store, many of which (as you might can imagine) were influenced by some of my favorite groceries:
- Nature's Own 100% Whole Wheat Bread
- Kraft Deluxe Sharp Macaroni & Cheese (14 oz) -- sadly, this one disappeared from Walmart and Kroger shelves more than a decade ago...
- Welch's Concord Grape Jelly
- Oscar Mayer Beef Bologna (8 oz)
- Minute Maid Premium Orange Juice (1 gal) -- surprised I went with the regular; even today I unashamedly buy the "kids" variety
- Diet Coke 12-pack cans
- Doritos Spicy Nacho Chips (13 oz) -- spicy >>> regular
- Campbell Condensed Vegetable Alphabet Soup (10 oz)
- General Mills Cookie Crisp Cereal (12.25 oz)
- Del Monte Fresh Cut Green Beans (14.5 oz) -- I did always like my vegetables

The total weekly average is shown at the bottom of the data page, and presented in visual format on this nifty little Microsoft Excel graph page, too (ah, the wonders of modern technology!). You can see Walmart was the lowest at $22.56. Kroger, inclusive of its sale prices, came in $3.03 higher, at $25.59. For its part, Schnucks averaged $26.53 with sale prices, but at regular prices, Kroger and Schnucks were only pennies apart (albeit both nearly $7 more than Walmart's "everyday low prices").
For fun... and because I'm a weirdo who actually considers such a thing to be "fun"... I decided it would be neat to reperform this experiment in 2023, and see how the prices compare now to back then. Would the results remain similar? Is Walmart still the cheapest? How much have prices gone up?
To make the process simpler (and because I sure as heck am not going to spend as much time on this part of the ordeal, even though one could argue this blog post in total is more time than I spent on the entire original project...), I opted to take the "quick and dirty" route for my 2023 price comparison. First of all, Schnucks left the Mid-South in 2011, so there's one competitor down. For Walmart and Kroger, I simply opened up their apps on my phone (on Monday, October 16, 2023) and looked up the prices that way. Some items, it should be noted, aren't available locally here in Ridgeland and/or anymore at Walmart or Kroger, so I've selected the next closest substitute as necessary. (It would also be an interesting commentary to analyze how product sizes have changed, but that's beyond the scope of this particular exercise.) Finally, on the Kroger side of things, I've collected only sale prices -- not bothering with regular prices this time around. Below, my results:
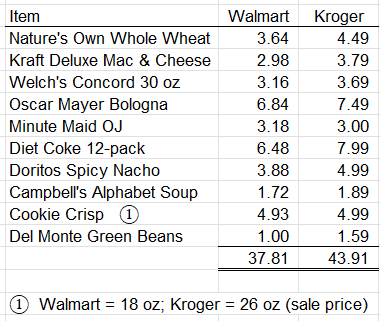
As you can see, Kroger in some instances still has sale prices better than Walmart (notably the Cookie Crisp, which -- because the two stores now sell different-sized packages -- nets you 8 more ounces for only 6 more cents), but Kroger still loses overall with a total price of $43.91 as compared to Walmart's $37.81 (a difference of $6.10).
What do these results tell us? Read on to find out...
--------------------------------------------------
As a student who never particularly enjoyed his science classes, it pains me to come to this realization, but a science fair project isn't all that different, fundamentally speaking, from an audit. For those of you who weren't already aware from past information I've shared about my life on flickr and my blog, these days I am a licensed CPA working as an independent external auditor. In a science experiment, you derive a hypothesis and then perform certain tests to confirm whether or not the evidence that you collect actually supports that hypothesis as being true, or outs it as being false. In an audit, the company we are auditing is making representations about its financial standing at a specific point in time and its financial performance over a specific period of time (leading up to that specific point). As auditors, we come in and gather evidence to determine, within a degree of reasonable (but not absolute!) certainty, whether or not management's assertions appear correct. In a science experiment, the end result is a conclusion on what the procedures performed reveal about the initial hypothesis. In my line of work, the deliverable is our evidence-based independent auditors' opinion on the company's financial statements. In principle (if not in practice), not too dissimilar, all things considered.
Looking closer, an analytical procedure holds even more of a resemblance to a science fair project. Analytical procedures are one specific type of test that auditors use, and really don't provide actually much concrete evidence at all; they are not considered to be a substantive test, which involves obtaining actual physical evidence to support the numbers (or whatever other assertion[s]) we're looking at. Instead, the main evidence that analytical procedures provide is simply an assessment of reasonableness, basically as if it's a smell test... does the actual outcome that we're seeing look more or less like it is correct, given what we'd estimate the same outcome to be based on past knowledge (which we still expect to hold true) and current trends (whose impact on our past knowledge we can appropriately account for)? Or, does the actual outcome smell a little fishy, as if there are some other factors impacting it that warrant some further digging? Recognizing that reliance on analytical procedures alone does not provide the same form of obvious substantial audit evidence as other, more involved tests, they nonetheless can give us comfort over something that feels like it looks reasonably okay, or point us in the direction of something that may need a little more attention.
So. If the analytical procedure is intended to test for reasonableness, then "precision" is the metric that we use to define what we consider to be within the realm of reason. Precision is typically expressed as a dollar amount, and most commonly as some form of materiality. "Materiality" is what auditors use to judge what matters. What matters to me -- in many senses, not just monetarily! -- might not matter to you. Likewise, as an explicit monetary illustration, $500 might not matter much at all to some big insurance conglomerate, but it might matter a heck of a lot to that small nonprofit organization down the street. In an analytical procedure we are looking to see if the actual results that we encounter make sense in comparison to the expected results that we calculate, and look to explain any difference, or "variance," between the two. If the variance is small enough to be below our stated precision -- that is, deemed "immaterial" -- we accept the results as "within expectation," and move on with our lives. Any variances that are outside of auditor expectation invite further investigation.
Let's all put our auditor hats on, on top of our second grade science fair beanies we're already wearing (all complete with little propellors, of course!), for this next bit. We know what the results of my experiment were in 2006. We also know what the results are for 2023. Going to our trusty friend Mr. Internet, we can obtain independent external evidence on what effects inflation has had on the US economy as a whole over those 17 years. Using that information, we can derive an auditor's expectation -- form a hypothesis -- of what we think the Walmart and Kroger prices should be. And finally, when we perform our test to compare those "should be" prices to the prices that actually are, we can evaluate and conclude on whether the difference is immaterial (the increase is due exclusively to inflation) or whether there are other factors at play (Walmart and Kroger have raised their prices beyond the normal inflation amounts).
Not the type of blog post you expected to jump into, is it?
--------------------------------------------------
Since they've been proven twice over to be the cheapest, with all others looked at in comparison to their baseline prices, we'll continue to use Walmart as the basis for our analysis, as the certified Low Price Leader™. (Actually, that tagline belonged to Fred's, but they don't exist anymore. Their auditors were right to give them a going concern opinion in 2018.) For materiality purposes, since this procedure is relying highly on small dollars and cents, let's say anything more than $1.00 will be outside of our expectation.
We'll begin by gathering some evidence on inflation. According to the website Carbon Collective, the total inflation rate between 2006 and 2023 is 49.23%. This is calculated by taking the difference between the Consumer Price Index (CPI) in 2023, which is 300.84, and in 2006, which was 201.6, and converting to a percentage, as follows:
From this, we can reasonably say that, all else held equal, we would expect Walmart's prices to have gone up by approximately 49 percent due to inflation. Any increase much more than that amount would suggest that consumers are paying comparatively more than they did in 2006 for the same (or similar) items. Let's see:

An inflation-related increase of 49% on Walmart's 2006 prices would lead us to expect that the 2023 prices should be around $33.67. However, the actual prices we are witnessing total $4.14 greater than that, which exceeds the $1.00 wiggle room we set for ourselves. Therefore, of Walmart's total 2006-to-2023 price increase of $15.25, approximately 27 percent is due to factors other than inflation.
We could analyze Kroger in the same way, but at the Kroger level there are not one but two factors at play. First is the basic inflation factor, like we just saw with Walmart. But second is the competition factor: that is, has Kroger maintained the same ratio of cost competitiveness with Walmart that it had back in 2006? Has it narrowed the margin and gotten closer to Walmart's prices? Or has it become even more expensive than Walmart than it was 17 years ago? Let's take a look.
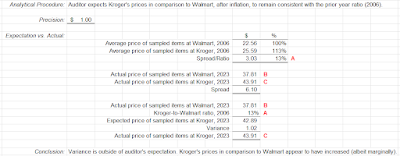
As it turns out, Kroger is basically just as competitive with Walmart as it was 17 years ago. In the analysis above, we determined that Kroger's prices were approximately 13 percent greater than Walmart's back in 2006. We would expect that ratio to remain consistent, even after inflation. So, taking Walmart's present-day 2023 prices and increasing those by 13 percent allegedly should get us somewhere close to Kroger's present-day 2023 prices. Indeed, we find that Kroger's 2023 prices of $43.91 are a mere $1.02 greater than our calculated expectation of $42.89. Technically, that is two cents outside of our precision, and it really depends on how you look at it: percentage-wise, it's a 16 percent ratio as opposed to 13 percent, which is a 23 percent increase (3 percent change divided by the original 13 percent ratio). But ultimately, regardless of the percentages, $1.02 really doesn't make a whole lot of difference to my wallet (your results may vary). I still feel comfortable in saying Kroger hasn't become noticeably more relaxed -- and certainly it hasn't gone the other direction and gotten any more aggressive! -- in its competitive stance with Walmart. Whether or not it's a good thing, though, that this status quo has been left more or less in place, eroding only slightly -- is left up to you, the consumer, to decide!
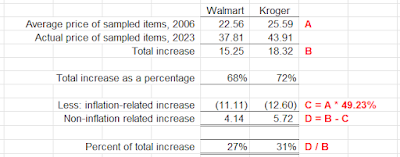
Above is a final summary of the 2023 results. Prices at Walmart increased 68 percent between 2006 and 2023 on our sampled grocery items, approximately 27 percent of which appears to be related to factors other than inflation. At Kroger, (sale) prices jumped 72 percent, 31 percent of which seems non-inflation related. Although not shown in this summary, as noted previously, the ratio of Kroger's prices to Walmart's prices still remains mostly consistent, having slipped just a marginal amount into more expensive territory.
Remember that all of this is a very simplified analysis, and we're not doing any actual further research to determine the truth of what all we just looked at. For instance, we are assuming that profit margins are what's causing the difference -- that is, that the increase in Walmart's and Kroger's prices not accounted for by inflation is simply going straight into their pockets as profit. That may very well be untrue. Profit margins for the retailers may well be unchanged, and there are other factors we are not seeing -- inflation-related, or otherwise -- on the manufacturers' and suppliers' side of things that have caused the additional increase in Walmart's and Kroger's prices. Without gathering tons more evidence -- a lot of which probably isn't even publicly accessible -- and going much more in-depth, we have no way of knowing with absolute certainty. But again... given the limitations and constraints of this particular experiment... we can at least conclude that 1) there definitely appears to be more than just inflation at play in these price increases, and 2) the result of that, absent any evidence to the contrary, is that consumers appear to be giving up more out of their pocket for the same items in 2023 than they did in 2006.
--------------------------------------------------
I was originally intending to write a considerably different blog post today, one that, oh, I don't know, actually involves pictures I took of some retail place in the past, and certainly zero references to my education or my profession (!)... but, clearly, I got sidetracked :P Even if a lot of this went over your head, I hope you still found the post enjoyable! And if not, well, please accept my apologies, lol. Hopefully I'll be back next month with something a bit more up your alley. Until then and as always, thanks for reading, and have fun exploring the retail world wherever you are!
Retail Retell